こんにちは。まろCです。
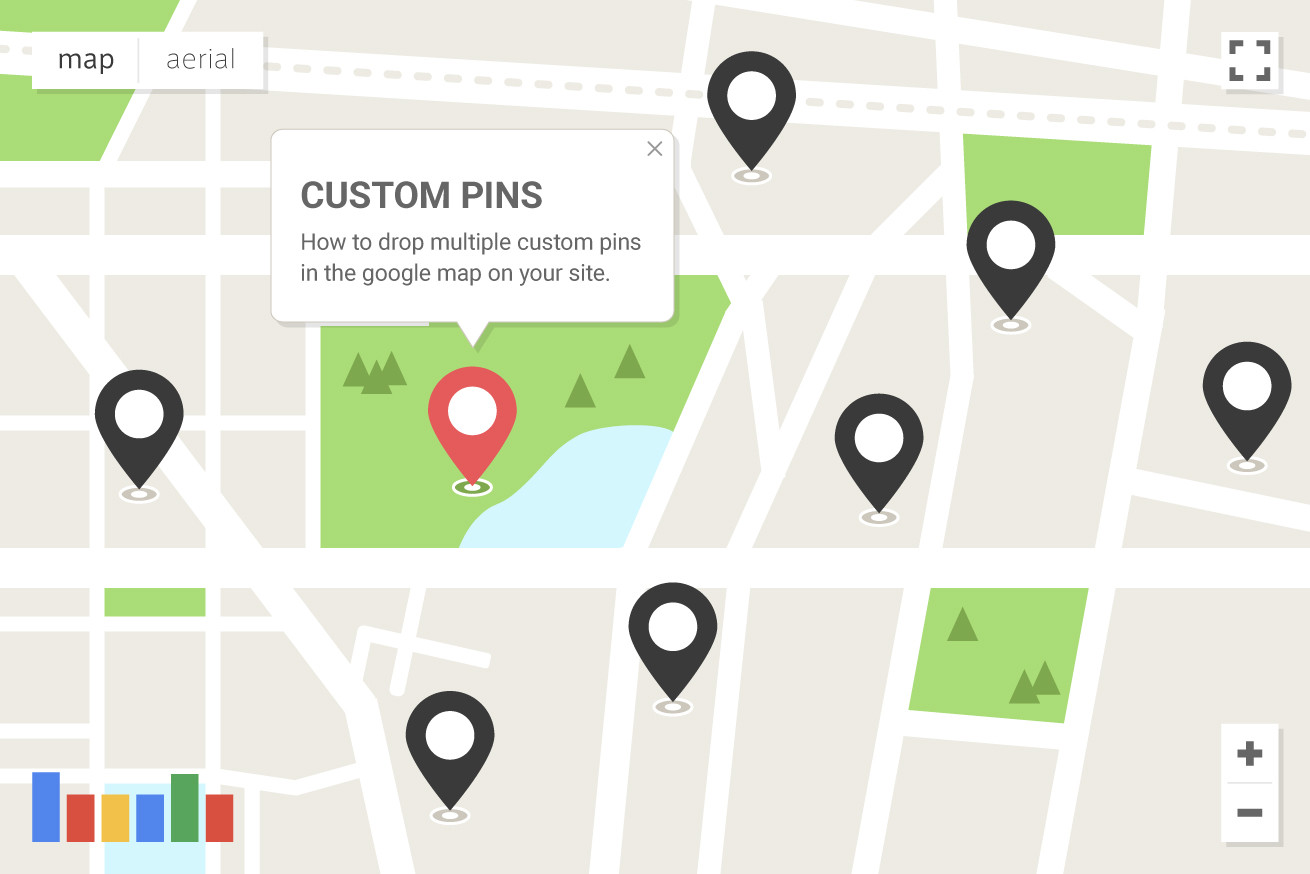
今回は、サイト内のgoogle mapに複数のカスタムピンとポップアップの情報を載せる方法を、実例をもとに紹介していきたいと思います。
その方法を利用して制作した案件
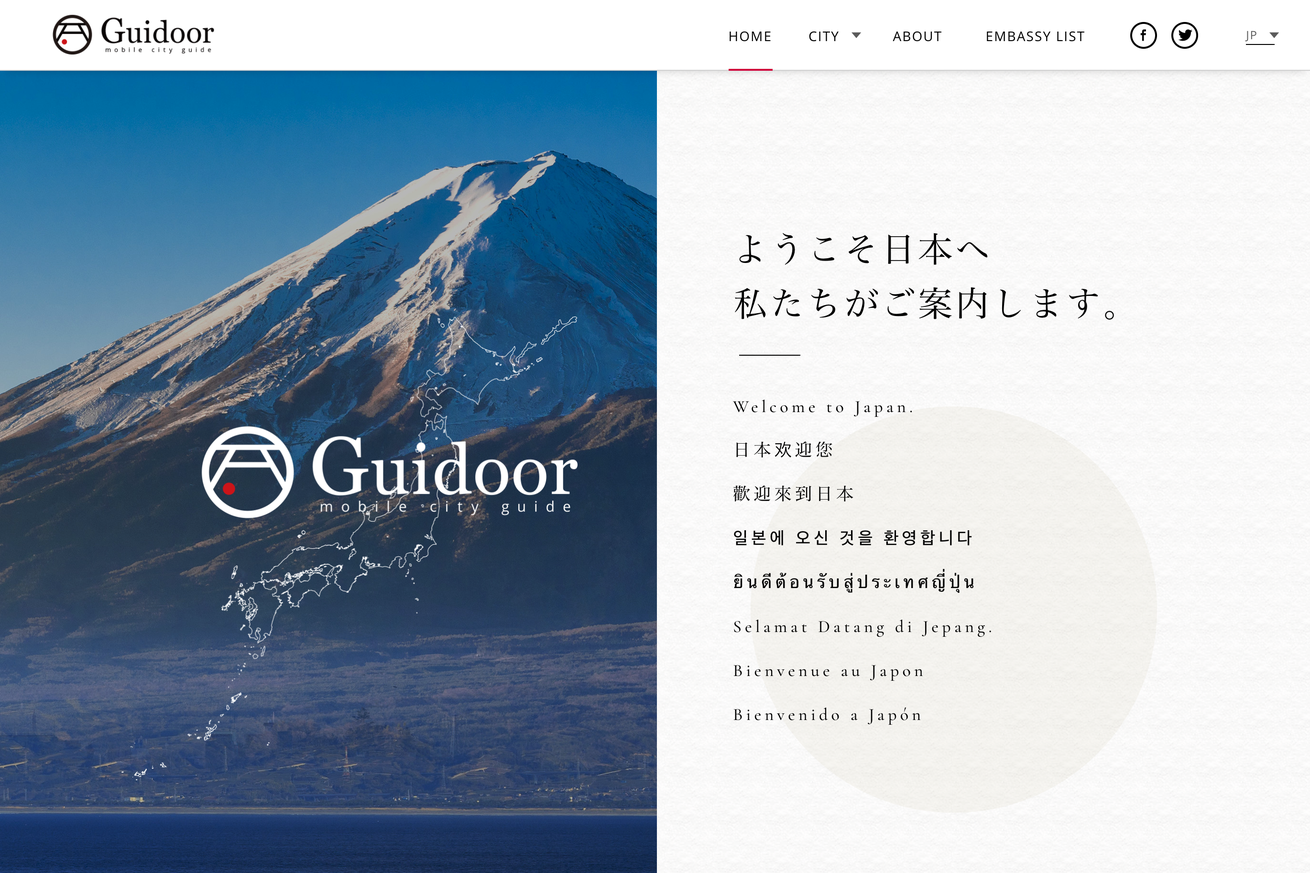
今回実例として取り上げるのは、「観光スポットにある案内板と連動して情報を取得する」という新しい試みを取り入れた、多言語対応の観光情報サイトです。僕はフロントエンドエンジニアとして制作に関わらせていただきました。
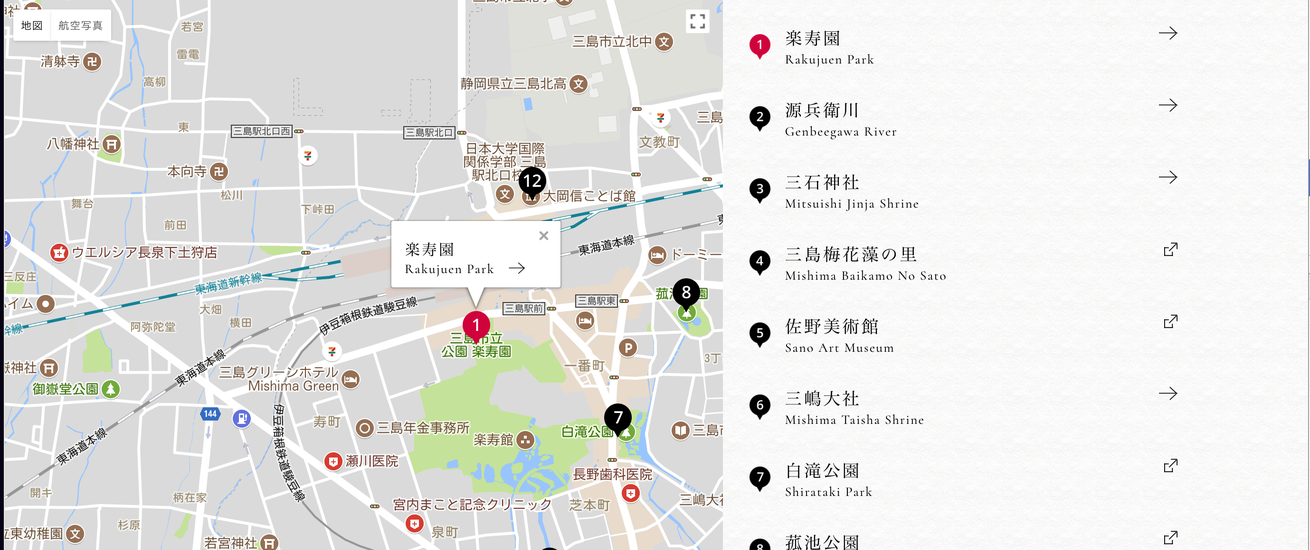
https://www.guidoor.jp/city/mishima/
たとえばこのページでは、各市の観光スポットを一覧確認できます。その情報を地図上でも追えるように、google map上にカスタムされたピンを落としています。
データの用意
複数データを動的に作成するため、htmlでは以下のようにリストを作ります。
<div id="js-city-section__map-list" class="city-section__map-list">
        <ul id="js-spot-lists" class="spot-lists">
          <li class="spot-list is-current" data-lat="35.1248742" data-lng="138.9109075">
             <div class="spot-list__icon">
                <img class="spot-list__icon-current" src="https://www.guidoor.jp/wordpress/assets/images/city/pin_red1.png" alt="">
                 <img class="spot-list__icon-normal" src="https://www.guidoor.jp/wordpress/assets/images/city/pin_black1.png" alt="">
              </div>
              <p class="spot-list__title">
                <span class="spot-list__title-jp">楽寿園</span>
                 <span class="spot-list__pipe"></span>
                 <span class="spot-list__title-en">Rakujuen Park</span>
              </p>
              <a class="spot-list__arrow" href="https://www.guidoor.jp/place/mishima/rakujuen-park/">
                 <i class="icon icon-link-mini"></i>
              </a>

 〜
  〜
  〜
      </ul>
    </div>
mapの生成に必要なデータはdata属性に持たせています。
次に、map用にhtmlを用意しておきます。
<div id="js-city-section__map-canvas" class="city-section__map-canvas" style="position: relative; overflow: hidden;"></div>mapの作成
先程のデータをJSでmapに落としていきます。
まずは全てのソースを御覧ください。
const CENTER_LAT = $items.eq(0).data('lat');
        const CENTER_LNG = $items.eq(0).data('lng');
        const ICON_W = 58/2;
        const ICON_H = 72/2;
        let map;
        let marker = [];
        let infoWindow = [];

        function init() {
            if($('#js-city-section__map-canvas').length < 1) {
                return;
            }
            let mapOptions = {
                center: new google.maps.LatLng(CENTER_LAT, CENTER_LNG),
                zoom: (window.UA.isSP)? 15 :16,
                zoomControl: true,
                disableDoubleClickZoom: false,
                mapTypeControl: true,
                scaleControl: true,
                scrollwheel: false,
                panControl: true,
                streetViewControl: false,
                draggable : true,
                overviewMapControl: false,
                overviewMapControlOptions: {
                    opened: false
                },
                mapTypeId: google.maps.MapTypeId.ROADMAP
            };
            let mapElement = document.getElementById('js-city-section__map-canvas');
            map = new google.maps.Map(mapElement, mapOptions);
            //ピンの設置
            for(let i = 0; i < $items.length; i++) {
                let $item = $items.eq(i);
                let markerLatLng = new google.maps.LatLng({
                    lat: parseFloat($item.data('lat')),
                    lng: parseFloat($item.data('lng'))
                }); // 緯度経度のデータ作成
                let iconClass = (i === 0)? '.spot-list__icon-current': '.spot-list__icon-normal';
                marker[i] = new google.maps.Marker({ // マーカーの追加
                    animation: google.maps.Animation.DROP,
                    position: markerLatLng, // マーカーを立てる位置を指定
                    map: map, // マーカーを立てる地図を指定
                    icon: {
                        url: $item.find(iconClass).attr('src'),// マーカーの画像を変更
                        scaledSize : new google.maps.Size(ICON_W, ICON_H)
                    }
                });

                let $icon = '<i class="icon icon-link-mini"></i>';
                let $blank = '';
                if($item.find('.spot-list__arrow').attr('target') === '_blank') {
                    $icon = '<i class="icon icon-blank"></i>';
                    $blank = 'target=_blank';
                }
                infoWindow[i] = new google.maps.InfoWindow({ // 吹き出しの追加
                    content: `<div class="map-popup"><a href="${$item.find('.spot-list__arrow').attr('href')}" ${$blank}><p><strong>${$item.find('.spot-list__title-jp').text()}</strong></p><p><small>${$item.find('.spot-list__title-en').text()}</small>${$icon}</p></a></div>`
                });

                markerEvent(i); // マーカーにクリックイベントを追加
            }
            infoWindow[0].open(map, marker[0]);
        }
        // マーカーにクリックイベントを追加
        function markerEvent(i) {
            marker[i].addListener('click', function() { // マーカーをクリックしたとき
                closeInfoWindow();
                infoWindow[i].open(map, marker[i]); // 吹き出しの表示
                //マーカー色変更
                changeIcon(i);
                //リストの色変更
                changeCurrent(i);
            });
        }
        function panToSelectedMap(i) {
            //選択したcenterに移動
            let $list = $items.eq(i);
            map.panTo(new google.maps.LatLng($list.data('lat'), $list.data('lng')));
            closeInfoWindow();
            infoWindow[i].open(map, marker[i]);
        }
        function moveMapOffsetTop() {
            //地図の上部までスクロール
            $('html, body').stop().animate({
                scrollTop: $('#js-city-section__map-box').offset().top - 130
            });
        }
        function closeInfoWindow() {
            for(let i = 0; i < infoWindow.length; i++) {
                infoWindow[i].close(map, marker[i]);
            }
        }
        function changeCurrent(i) {
            let $list = $items.eq(i);
            $items.removeClass('is-current');
            $list.addClass('is-current');
            changeIcon(i);
        }
        function changeIcon(i) {
            let iconClass = null;
            for(let k = 0; k < marker.length; k++) {
                if(k === i) {
                    iconClass = '.spot-list__icon-current';
                } else {
                    iconClass = '.spot-list__icon-normal';
                }
                marker[k].setOptions({
                    icon: {
                        url: $items.eq(k).find(iconClass).attr('src'),// マーカーの画像を変更
                        scaledSize : new google.maps.Size(ICON_W, ICON_H)
                    }
                });
            }
        }


        init();
フローは以下の通りです。
通常のマップを作成
let mapOptions = {
  center: new google.maps.LatLng(CENTER_LAT, CENTER_LNG),
  zoom: (window.UA.isSP)? 15 :16,
  zoomControl: true,
  disableDoubleClickZoom: false,
  mapTypeControl: true,
  scaleControl: true,
  scrollwheel: false,
  panControl: true,
  streetViewControl: false,
  draggable : true,
  overviewMapControl: false,
  overviewMapControlOptions: {
    opened: false
  },
  mapTypeId: google.maps.MapTypeId.ROADMAP
};
let mapElement = document.getElementById('js-city-section__map-canvas');
map = new google.maps.Map(mapElement, mapOptions);
オプションを設定して、マップをつくる。いつものやり方です。
ピンの設置
html上で用意したデータをループさせて、ピンを作成します。
let $items = $('#js-spot-lists li');
〜
〜
〜
//ピンの設置
            for(let i = 0; i < $items.length; i++) {
                let $item = $items.eq(i);
                let markerLatLng = new google.maps.LatLng({
                    lat: parseFloat($item.data('lat')),
                    lng: parseFloat($item.data('lng'))
                }); // 緯度経度のデータ作成
                let iconClass = (i === 0)? '.spot-list__icon-current': '.spot-list__icon-normal';
                marker[i] = new google.maps.Marker({ // マーカーの追加
                    animation: google.maps.Animation.DROP,
                    position: markerLatLng, // マーカーを立てる位置を指定
                    map: map, // マーカーを立てる地図を指定
                    icon: {
                        url: $item.find(iconClass).attr('src'),// マーカーの画像を変更
                        scaledSize : new google.maps.Size(ICON_W, ICON_H)
                    }
                });

                let $icon = '<i class="icon icon-link-mini"></i>';
                let $blank = '';
                if($item.find('.spot-list__arrow').attr('target') === '_blank') {
                    $icon = '<i class="icon icon-blank"></i>';
                    $blank = 'target=_blank';
                }
                infoWindow[i] = new google.maps.InfoWindow({ // 吹き出しの追加
                    content: `<div class="map-popup"><a href="${$item.find('.spot-list__arrow').attr('href')}" ${$blank}><p><strong>${$item.find('.spot-list__title-jp').text()}</strong></p><p><small>${$item.find('.spot-list__title-en').text()}</small>${$icon}</p></a></div>`
                });
}
google.maps.InfoWindow内では好きにhtmlを組むことができます。
CSSで装飾していい感じにしましょう。
ポップアップにクリックイベントを付与
せっかく作っても、イベントをつけないと先ほどのポップアップが見れないので、クリックイベントをつけます。
// マーカーにクリックイベントを追加
        function markerEvent(i) {
            marker[i].addListener('click', function() { // マーカーをクリックしたとき
                closeInfoWindow();
                infoWindow[i].open(map, marker[i]); // 吹き出しの表示
                //マーカー色変更
                changeIcon(i);
                //リストの色変更
                changeCurrent(i);
            });
        }
いろいろとやっていますが、処理の流れは、開いているポップアップを閉じる→クリックされたピンのポップアップを開く、となります。
その他の作業
guidoorでは、その他以下の処理も行っています。
- ピンがクリックされたら、ピン画像をアクティブなものに変更する
- 右のリストをクリックしたら、map上のその地点に移動し、ポップアップが開く。
こちらの処理も全体のソース内に書いていますので、興味があれば読んでみてください。
まとめ
いかがでしたか? 結構簡単にできますので、自分なりのカスタマイズを試してみてくださいね。
それでは!
LIGはWebサイト制作を支援しています。ご興味のある方は事業ぺージをぜひご覧ください。
