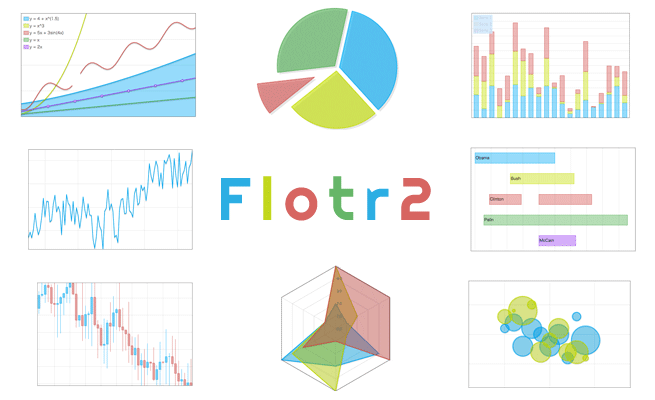
HTML5のcanvas機能を使用してグラフが作成出来るライブラリ、「Flotr2」がとても素敵だったので試してみました。グラフは円グラフ・棒グラフ・折れ線グラフなど様々な形での表現が可能です。
使用方法
使用するときのルールは以下の通りです。
- 「flotr2.min.js」を読み込む
- グラフを表示するdivのID名を決めて、ソースを書き換える(デモでは「#graph」)
- 上記IDにwidth、heightを設定する
あとはサンプルのソースの数値や項目名など書き換えればOK。
デモ
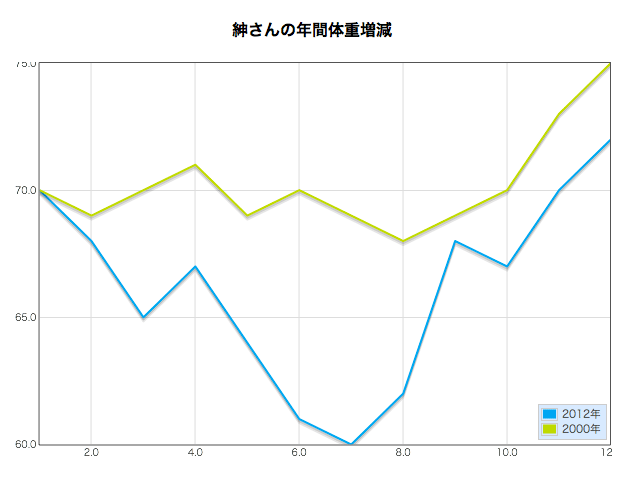
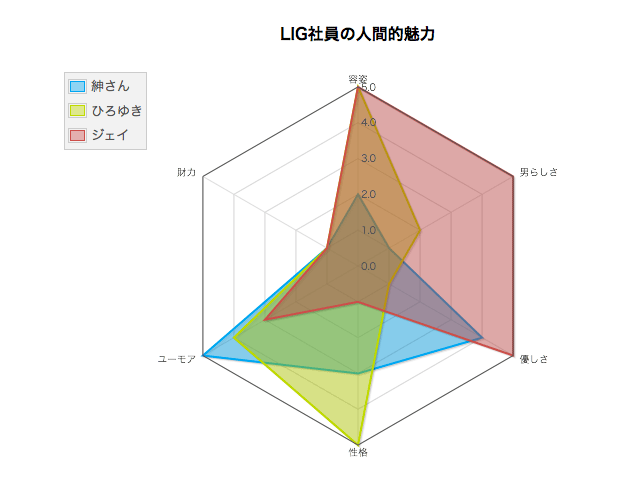
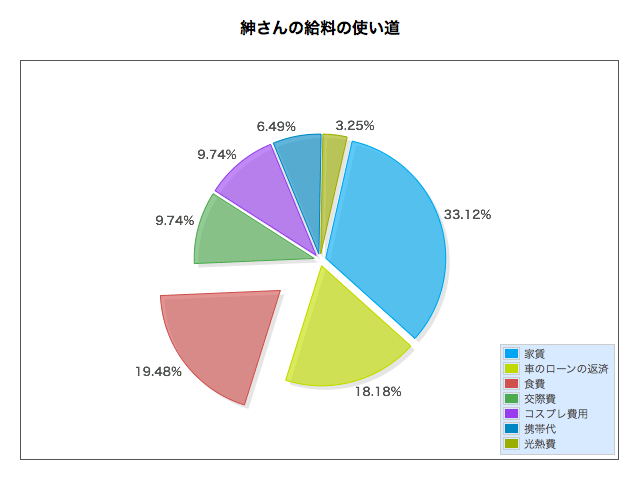
表現出来るグラフが紹介しきれないくらいたくさんあるので、汎用性のある折れ線グラフ、レーダーチャート、円グラフを試してみました。
折れ線グラフ
<br />
<!DOCTYPE html><br />
<html lang="ja" dir="ltr"><br />
<head><br />
<meta charset="utf-8"></p>
<style type="text/css">
#graph {
	width : 600px;
	height: 400px;
	margin: 20px auto;
}
.graph-title {
	font-size:16px;
	font-weight:bold;
	text-align:center;
	margin:50px 0 0;
}
</style>
<p><script type="text/javascript" src="js/flotr2.min.js"></script><br />
</head><br />
<body></p>
<p class="graph-title">紳さんの年間体重増減</p>
<div id="graph"></div>
<p><script type="text/javascript">
(function basic(container) {
    var d1 = [
        [1, 70],
        [2, 68],
        [3, 65],
		[4, 67],
		[5, 64],
		[6, 61],
		[7, 60],
		[8, 62],
        [9, 68],
		[10, 67],
        [11, 70],
		[12, 72]
    ],
        d2 = [
        [1, 70],
        [2, 69],
        [3, 70],
		[4, 71],
		[5, 69],
		[6, 70],
		[7, 69],
		[8, 68],
        [9, 69],
		[10, 70],
        [11, 73],
		[12, 75]
    ],
    data = [{
        data: d1,
        label: "2012年"
    }, {
        data: d2,
        label: "2000年"
    }];</p>
<p>    function labelFn(label) {
        return label;
    }</p>
<p>    graph = Flotr.draw(container, data, {
        legend: {
            position: "se",
            labelFormatter: labelFn,
            backgroundColor: "#D2E8FF"
        },
        HtmlText: false
    });
})(document.getElementById("graph"));
</script><br />
</body><br />
</html><br />
レーダーチャート
<br />
<!DOCTYPE html><br />
<html lang="ja" dir="ltr"><br />
<head><br />
<meta charset="utf-8"></p>
<style type="text/css">
#graph {
	width : 600px;
	height: 400px;
	margin: 20px auto;
}
.graph-title {
	font-size:16px;
	font-weight:bold;
	text-align:center;
	margin:50px 0 0;
}
</style>
<p><script type="text/javascript" src="js/flotr2.min.js"></script><br />
</head><br />
<body></p>
<p class="graph-title">LIG社員の人間的魅力</p>
<div id="graph"></div>
<p><script type="text/javascript">
(function basic_radar(container) {
    var s1 = {
        label: "紳さん",
        data: [
            [0, 2],
            [1, 1],
            [2, 4],
            [3, 3],
            [4, 5],
            [5, 1]
        ]
    },
        s2 = {
            label: "ひろゆき",
            data: [
                [0, 5],
                [1, 2],
                [2, 1],
                [3, 5],
                [4, 4],
                [5, 1]
            ]
        },
		s3 = {
            label: "ジェイ",
            data: [
                [0, 5],
                [1, 5],
                [2, 5],
                [3, 1],
                [4, 3],
                [5, 1]
            ]
        },
        graph, ticks;
    ticks = [
        [0, "容姿"],
        [1, "男らしさ"],
        [2, "優しさ"],
        [3, "性格"],
        [4, "ユーモア"],
        [5, "財力"]
    ];
    graph = Flotr.draw(container, [s1, s2, s3], {
        radar: {
            show: true
        },
        grid: {
            circular: true,
            minorHorizontalLines: true
        },
        yaxis: {
            min: 0,
            max: 5,
            minorTickFreq: 1
        },
        xaxis: {
            ticks: ticks
        }
    });
})(document.getElementById("graph"));
 </script><br />
</body><br />
</html><br />
円グラフ
パーセンテージは数値を入れると勝手に算出してくれます。
<br />
<!DOCTYPE html><br />
<html lang="ja" dir="ltr"><br />
<head><br />
<meta charset="utf-8"></p>
<style type="text/css">
#graph {
	width : 600px;
	height: 400px;
	margin: 20px auto;
}
.graph-title {
	font-size:16px;
	font-weight:bold;
	text-align:center;
	margin:50px 0 0;
}
</style>
<p><script type="text/javascript" src="js/flotr2.min.js"></script><br />
</head><br />
<body></p>
<p class="graph-title">紳さんの給料の使い道</p>
<div id="graph"></div>
<p><script type="text/javascript">
(function basic_pie(container) {
    var d1 = [
        [0, 51000]
        ],
        d2 = [
            [0, 28000]
        ],
        d3 = [
            [0, 30000]
        ],
        d4 = [
            [0, 15000]
        ],
		d5 = [
            [0, 15000]
        ],
		d6 = [
            [0, 10000]
        ],
		d7 = [
            [0, 5000]
        ],
        graph;
    graph = Flotr.draw(container, [{
        data: d1,
        label: "家賃"
    }, {
        data: d2,
        label: "車のローンの返済"
    }, {
        data: d3,
        label: "食費",
        pie: {
            explode: 50
        }
    }, {
		data: d4,
        label: "交際費"
    }, {
		data: d5,
        label: "コスプレ費用"
    }, {
		data: d6,
        label: "携帯代"
    }, {
        data: d7,
        label: "光熱費"
    }], {
        HtmlText: false,
        grid: {
            verticalLines: false,
            horizontalLines: false
        },
        xaxis: {
            showLabels: false
        },
        yaxis: {
            showLabels: false
        },
        pie: {
            show: true,
            explode: 6
        },
        mouse: {
            track: true
        },
        legend: {
            position: "se",
            backgroundColor: "#D2E8FF"
        }
    });
})(document.getElementById("graph"));
 </script><br />
</body><br />
</html><br />
簡単!そしてデザインが綺麗!オプションも様々なものが用意されているので、詳しくは下記リンクを参照して下さい。
https://humblesoftware.com/flotr2/documentation
ダウンロード・ライセンス等
ダウンロードは「flotr2」の公式サイトから。
紹介しきれなかった他の形のグラフもたくさん見る事が出来ます。
https://humblesoftware.com/flotr2
ライセンスはMIT Licenseです。
LIGはWebサイト制作を支援しています。ご興味のある方は事業ぺージをぜひご覧ください。
